Wikipedia vs Wall Street - Spurious Correlations
A data visualization tool finding absurd correlations between S&P 500 stocks and Wikipedia page views.
Programming

Click image to view details.
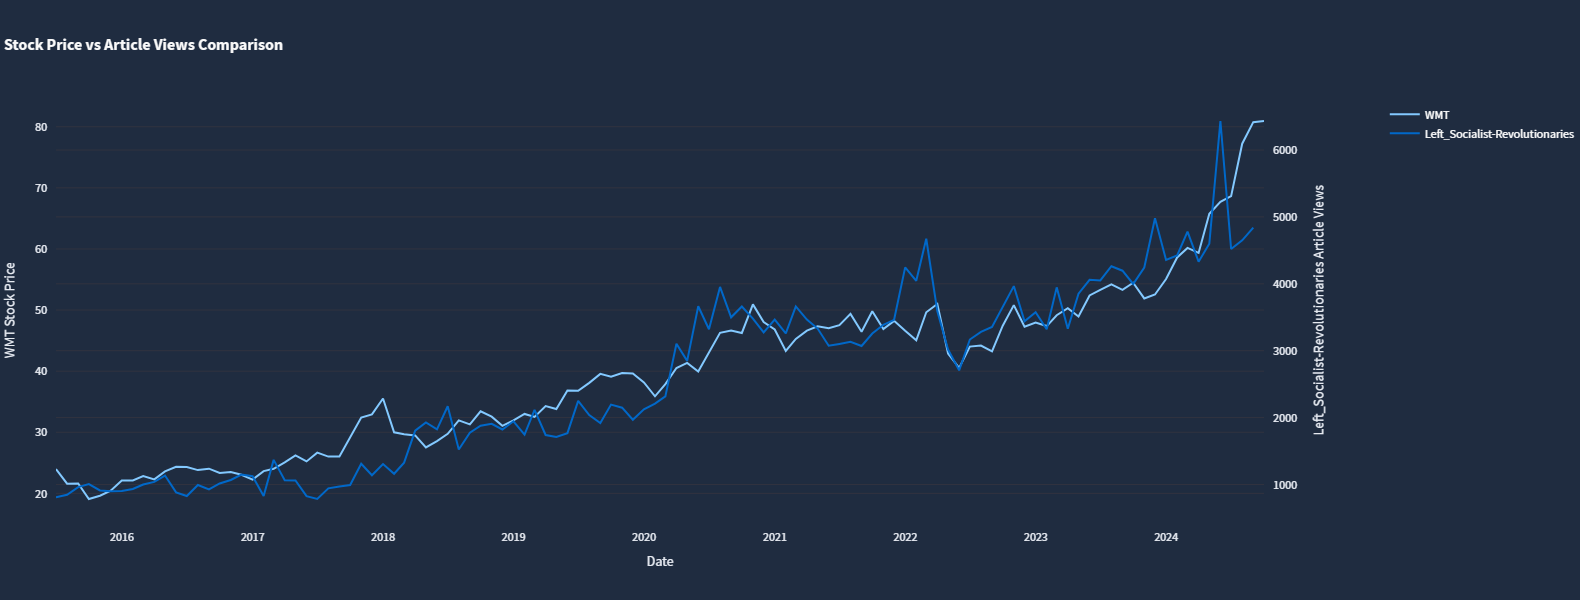
Ever wonder if the stock market follows the same trends as Wikipedia page views about banana bread? No? Well, inspired by Tyler Vigen’s “Spurious Correlations,” I built a tool to find the most absurd connections between S&P 500 stock prices and Wikipedia page view statistics.
Correlation will imply causation
The “Problem”
Stock market analysts spend countless hours trying to predict market movements using technical analysis, fundamental research, and probably crystal balls. But what if the real indicators were hiding in plain sight… on Wikipedia?
The “Solution”
I created a tool that:
- Downloads historical S&P 500 stock prices
- Grabs Wikipedia page view statistics
- Finds correlations between them
- Visualizes these statistically insignificant relationships
Technical Implementation
- Data Collection: Python scripts to grab stock prices and Wikipedia pageviews
- Storage: SQLite database
- Analysis: Pandas for number crunching and correlation hunting
- Visualization: Streamlit dashboard for interactive exploration
Notable Discoveries
Some of my favorite “findings” include:
- A 95% correlation between NVIDIA stock and the article views of “2025”, “Geography_of_south_korea”, and “Assassinated”
- A negative 86% correlation between Exxon Stock and “Facebook_Messenger” and “Faith_in_Christianity”
- Apple stock correlating 94% with the trend of “Left_Socialist-Revolutionaries”